Copper is the most used base metal. Apart from its role as a raw material, it acts as a barometer for the global economic health and its outlook. When the price of copper is trending, in either direction, there is an underlying message about the global economy.
Before looking into copper, let us start by reviewing the bigger picture of the commodities complex as a whole. The first chart below is a weekly chart of both commodities (brown line) and the U.S. dollar (green line). There was a perfect pattern set up which worked unbelievably well. The long term trendline for commodities dating back to 2009 did hold. The same is true for the long term trendline for the U.S. dollar.

That is the reason why we rely on charts: they are not random, but have mostly reliable patterns and trendlines which can help providing clues about the short and long term direction.
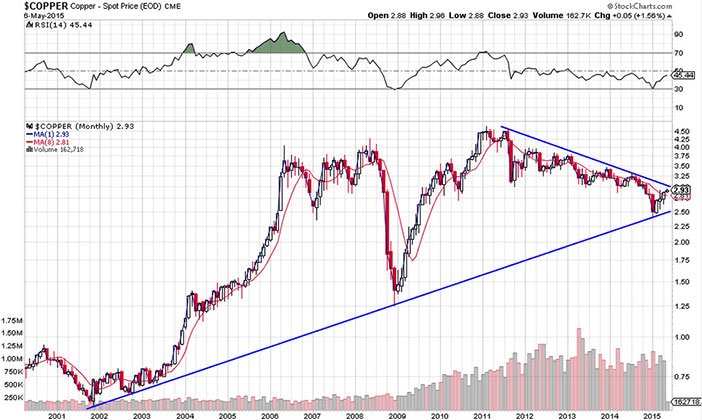
The dollar has retraced, commodities were able to take some breath. Similar to the chart structures discussed above, copper has an outspoken chart pattern. The very long term copper chart below (monthly timeframe) has tested two important trendlines this year. Early January, it successfully tested the 2002 / 2009 rising trendline, while it is now “as we speak” in the process to test the descending trendline dating back to the 2011 peak.
This is major, and there will be a resolution very soon. Our expectation is that 2015 will be a hallmark year. In whatever direction this trend will be resolved, there will be an incredibly important message to the world.
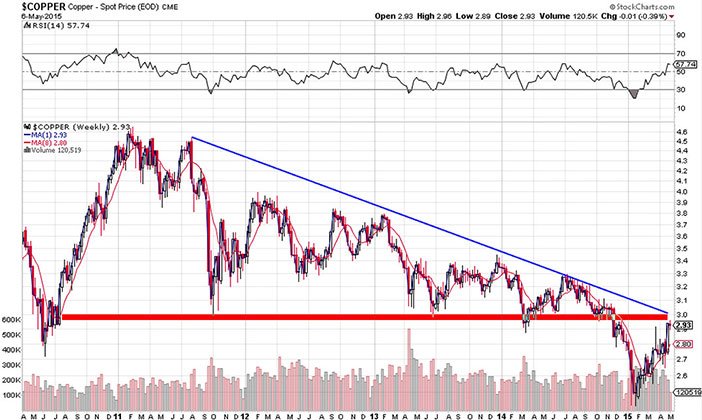
The first clues of trend directions are to be found on the smaller timeframes. Below chart shows copper on a weekly timeframe. It provides a confirmation of the cooking pressure we saw on the monthly chart. The disturbing fact on this chart is that the January lows were a first drop outside the chart pattern. So far, that appears to lack follow through, so this could turn out to the an invalid move.
However, as the combination of the trend and blue trendlines show, it is make-or-break time again in copper.
Depending on the evolution on the weekly and monhtly charts, we will know later this year what the mid-term direction will be of our economy. Both inflation and deflation are in the cards. Inflation expectations have been rising lately, so there is a chance that the central banks of this world are getting what they desire. The jury is still out though.


