Gold’s correction started in September 2011, after touching all-time highs around $1930 /oz. Today, at $1140 /oz, pessimism is probably around all-time highs as well. But how much lower can gold go?
In the short to mid term, we believe there is still some downside, potentially a lower low is coming. Why? Because our key indicator for the short to mid term price outlook in the COMEX futures market is flashing a warning signal.
We have said repeatedly that the “rate of change” of net short positions by commercial traders is the key indicator to watch. It provides a reliable clue on the stopping power of a rally.
What is that indicator telling us today? Well, as seen on the first chart below (black circle), the commercial traders have accumulated net short positions at an above average pace. The rate of change of their accumulation is high, which translates in “stopping power” when it comes to price behavior.
 Source: Sharelynx
On the longer term, however, the picture looks different. Historical standards tell us that this bear market has run its course, if history is any guidance of course. The next chart shows us that today’s bear market is close to becoming the longest one in history.
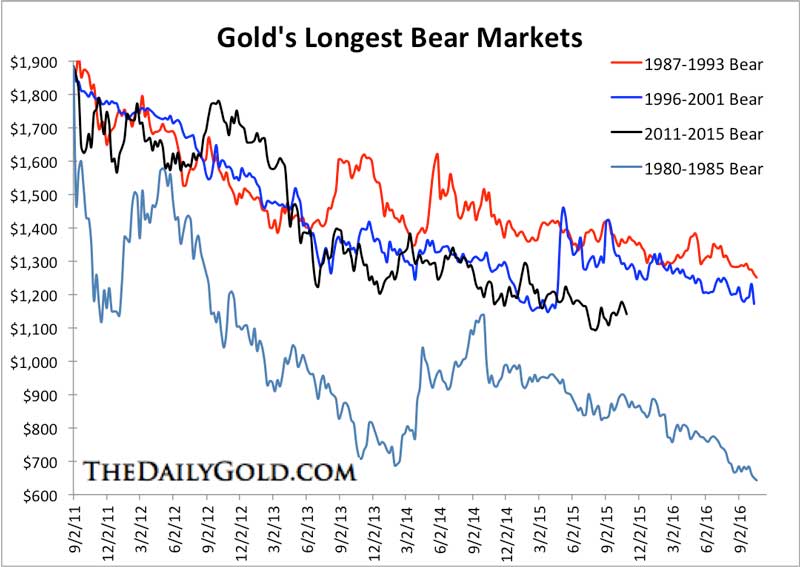 Source: The Daily Gold
That being said, how much downside is there left, even if this bear market will continue for another year, in which case it would become the longest bear market in history? There is not much room left to the downside, given the structure of bear markets. When carefully observing the second chart above, one can clearly see that the absolute bottom is being set around the 2nd year, following a very sharp reversal of a top. That type of extreme reversal occurs once.
Such a bear market behavior is visible in today’s bear market as well. It means that the drop of 2013 was the key event in this bear market, and prices can go somehow lower but not to a significant extent. We believe a final dip in gold is coming, one that would touch a price area around $1000 /oz (slightly lower is possible). That would drive every gold bull out of the market, setting the scene for a trend reversal, as that’s how bear markets turn into bull markets.


