Readers know by now that one of our leading indicators in the gold market is the positioning of commercial traders in the gold COMEX market. Now since two weeks, that indicators has become extremely bullish. Note that it is not a good timing indicator, it rather tells how much power there is in a rally and in a selloff.
In particular, we are closely watching the rate of change of short positions of commercial traders in the COMEX market, combined with the level of extremeness of their positions. In plain simple English: if the short positions decline in a very fast way, relative to previous declines, and reachextremely low levels, then it is very bullish for gold. The opposite is true as well.
The chart below, courtesy of Sharelynx (www.sharelynx.com) shows what we are saying. Look at the blue bars in the center pane, which are inside the green annotated rectangle. In the last couple of weeks, short positions of commercial traders have declined at a very high pace, and reached extremely low levels.
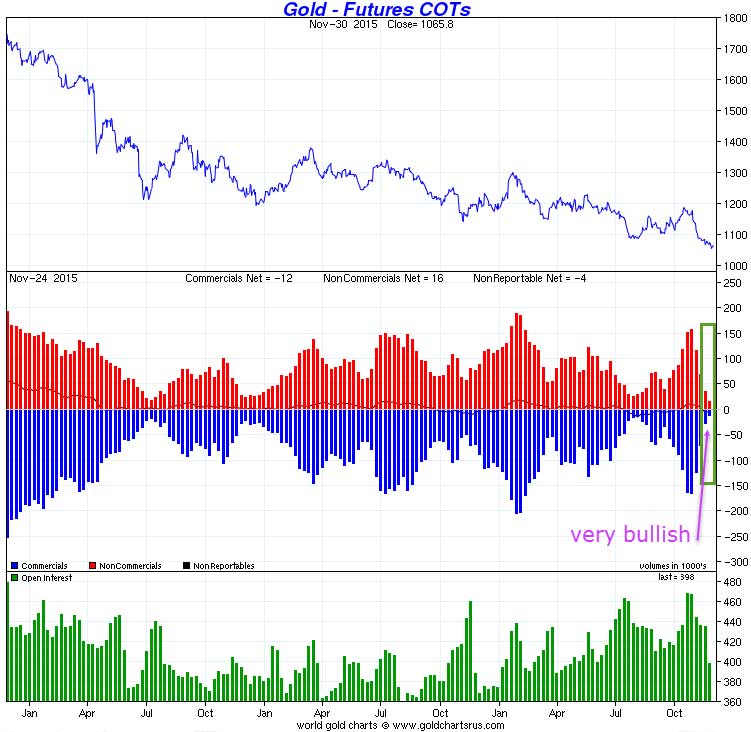
It tells us that the decline in gold is largely over, at least in the short run.
For do-it-yourself investors, the trick is the following: as short positions of commercial traders start to rise again, it is key to follow what the price is doing, and especially where price stops rising. As soon as an extreme level of short positions is reached, and the time is there to reverse the cycle, you should check whether price surpassed the peak of the previous rally. If not, which has been the case throughout this bear market, then it is a signal that the trend has not changed yet, and you better keep dry powder in the form of cash for the next rally.
For now, it appears that Mr. Draghi was the ‘reason’ why gold is soaring. While that is partly true, the ‘real’ reason is to be found in the COMEX positioning.


