The Fear Trade
It is often stated by precious metal experts that the winter months are the strongest for bullion. This perhaps should come as no surprise since the equivalent can be said for the equities market: as money flows into stocks, it can reasonably be theorized that additional funds may find itself into safe-haven assets as a safety measure against higher rates of inflation (since higher money velocity indicates more dollars chasing fewer goods). Also, stock market crashes have a tendency of occurring in the month of October, providing a “fear trade” incentive to acquire gold.
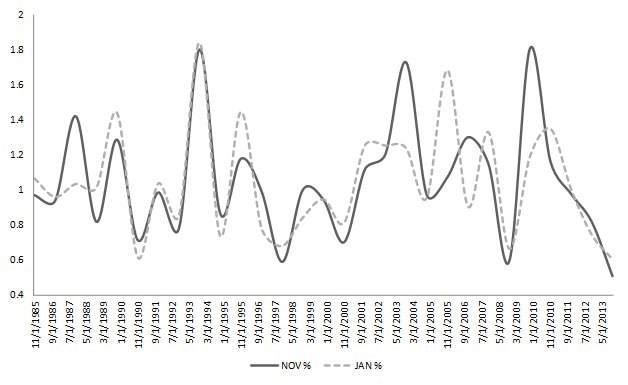
But a “same month over same month” comparison of the Gold Silver Index (XAU) from 1984 onwards may provide important clues as to the future trajectory of the precious metals complex. The month of January, for example, is relatively calm and stable when compared to Januarys of prior years. However, November tends to be radically different, with large swings in activity. The disparity between the performances of the two months is best illustrated graphically with a scatter-plot:
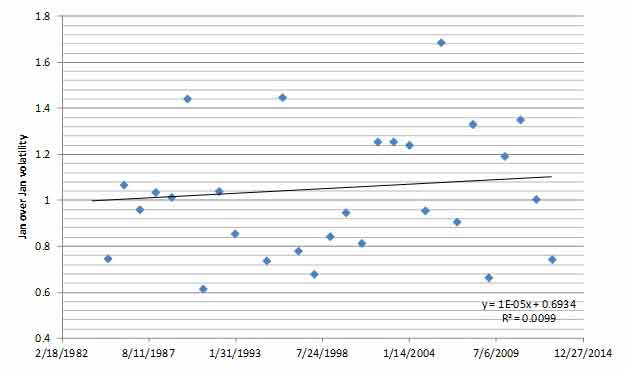

January’s price behavior is more condensed along its linear trend line, which has a positive trajectory, whereas November’s price behavior is more dispersed with a slightly negative trend line. While the “eyeballing” methodology may find minimal differences, the mathematical reality is the performances of these two months are radically different, with a statistical correlation of -0.05, or no correlation at all. Compare this result with the relationship of November’s performance with December, which has a very strong and significant correlation of 0.896.
However, when the statistical comparison between November and January are shifted to reflect different years (ie. comparing November 2000 data to January 2001 data), the result is a 0.717 performance correlation. In other words, as November goes, so goes January, at least in the metals market.
Down-Novembers
It’s also significant to note that the past four Novembers have consecutively recorded negative performances, a record feat that goes back to December 19th, 1983, when the XAU index was first established. Since the metals complex has always bounced back strongly from consecutive “down-Novembers,” there is a statistical basis in believing that the next year or the next few years will see a massive turnaround.
How high or how long a rally can ultimately soar is an analysis that can’t be covered over the scope of this article, but there is enough seasonal evidence to suggest that long-suffering metals investors may finally have their day in the sun.


